Pick
Perform quick astronomical stellar analysis.
Plugin Type: Local
Pick is a local plugin, which means it is associated with a channel.
It is not a singleton, which means multiple instances can be opened for
each channel.
Usage
The Pick plugin is used to perform quick astronomical data quality analysis
on stellar objects. It locates stellar candidates within a drawn box
and picks the most likely candidate based on a set of search settings.
The Full Width Half Max (FWHM) is reported on the candidate object, as
well as its size based on the plate scale of the detector. Rough
measurement of background, sky level and brightness is also done.
Defining the pick area
The default pick area is defined as a box of approximately 30x30 pixels that encloses the search area.
The move/draw/edit selector at the bottom of the plugin is used to determine what operation is being done to the pick area:
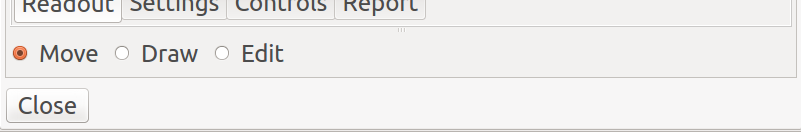
“Move”, “Draw”, and “Edit” buttons.
If “move” is selected, then you can move the existing pick area by dragging it or clicking where you want the center of it placed. If there is no existing area, a default one will be created.
If “draw” is selected, then you can draw a shape with the cursor to enclose and define a new pick area. The default shape is a box, but other shapes can be selected in the “Settings” tab.
If “edit” is selected, then you can edit the pick area by dragging its control points, or moving it by dragging in the bounding box.
After the area is moved, drawn or edited, Pick will search the area
for all peaks and evaluate the peaks based on the criteria in the
“Settings” tab of the UI (see “The Settings Tab” below) and try to locate
the best candidate matching the settings.
Note
the “Quick Mode” and “From Peak” checkboxes were removed in Ginga release v4.0.
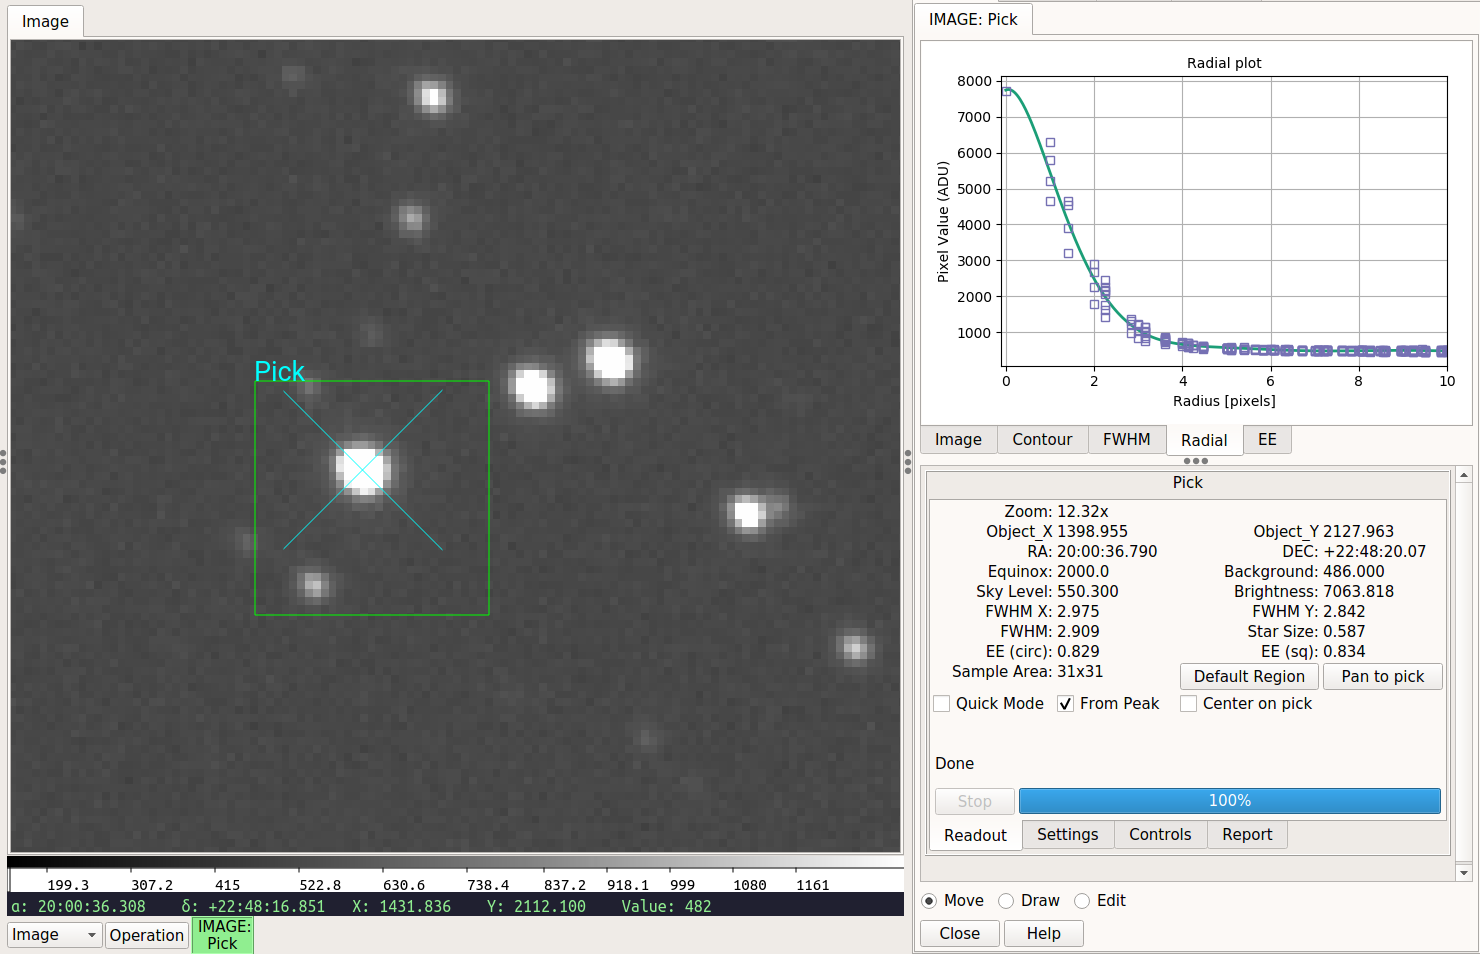
If a candidate is found
The candidate will be marked with a point (usually an “X”) in the channel viewer canvas, centered on the object as determined by the horizontal and vertical FWHM measurements.
The top set of tabs in the UI will be populated as follows:
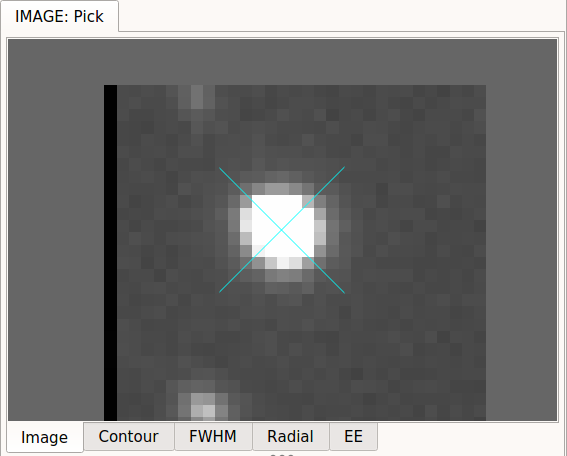
“Image” tab of Pick area.
The “Image” tab will show the contents of the cutout area. The widget in this tab is a Ginga widget and so can be zoomed and panned with the usual keyboard and mouse bindings (e.g., scroll wheel). It will also be marked with a point centered on the object and additionally the pan position will be set to the found center.
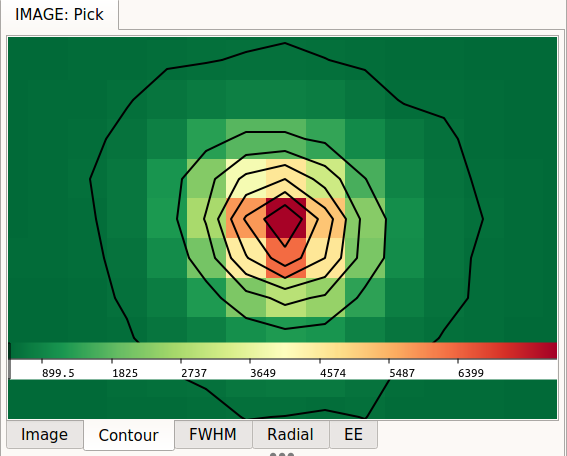
“Contour” tab of Pick area.
The “Contour” tab will show a contour plot. This is a contour plot of the area immediately surrounding the candidate, and not usually encompassing the entire region of the pick area. You can use the scroll wheel to zoom the plot and a click of the scroll wheel (mouse button 2) to set the pan position in the plot.
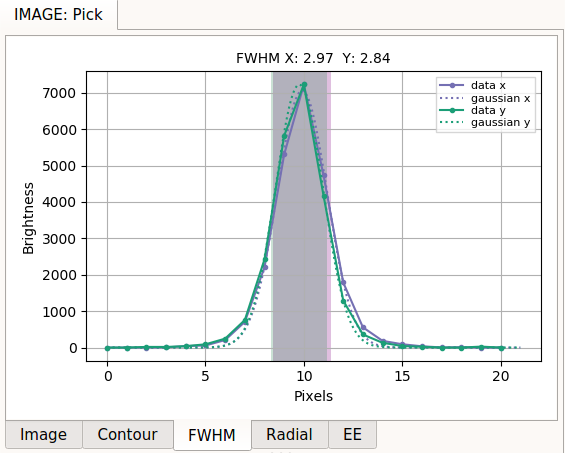
“FWHM” tab of Pick area.
The “FWHM” tab will show a FWHM plot. The purple lines show measurements in the X direction and the green lines show measurements in the Y direction. The solid lines indicate actual pixel values and the dotted lines indicate the fitted 1D function. The shaded purple and green regions indicate the FWHM measurements for the respective axes.
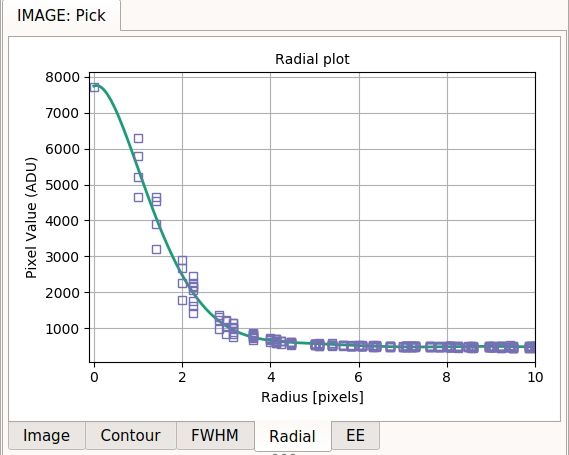
“Radial” tab of Pick area.
The “Radial” tab contains a radial profile plot. Plotted points in purple are data values, and a line is fitted to the data.
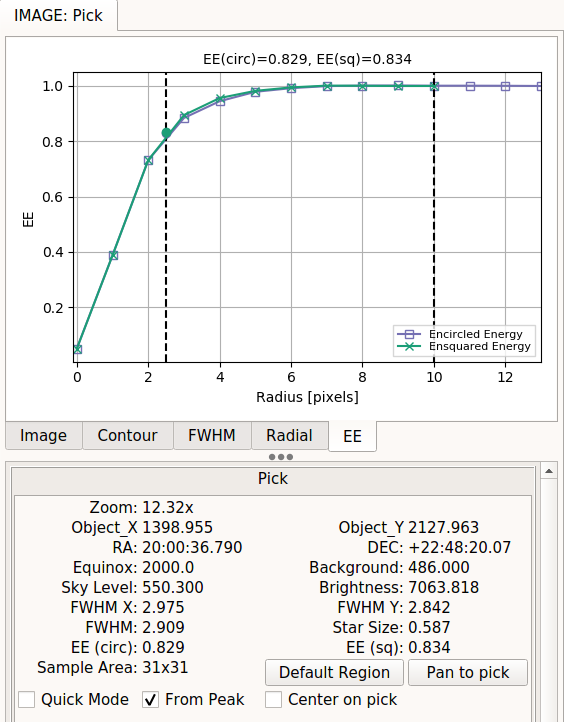
“EE” tab of Pick area.
The “EE” tab contains a plot of fractional encircled and ensquared energies (EE) in purple and green, respectively, for the chosen target. Simple background subtraction is done in a way that is consistent with FWHM calculations before EE values are measured. The sampling and total radii, shown as black dashed lines, can be set in the “Settings” tab; when these are changed, click “Redo Pick” to update the plot and measurements. The measured EE values at the given sampling radius are also displayed in the “Readout” tab. When reporting is requested, the EE values at the given sampling radius and the radius itself will be recorded under “Report” table, along with other information.
When “Show Candidates” is active, the candidates near the edges of the bounding box will not have EE values (set to 0).
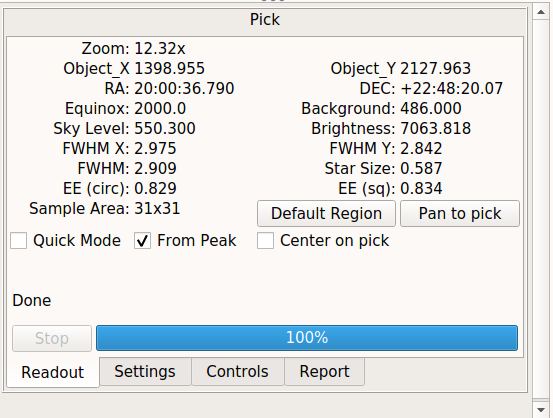
“Readout” tab of Pick area.
The “Readout” tab will be populated with a summary of the measurements. There are two buttons and three check boxes in this tab:
The “Default Region” button restores the pick region to the default shape and size.
The “Pan to pick” button will pan the channel viewer to the located center.
If “Center on pick” is checked, the shape will be recentered on the located center, if found (i.e., the shape “tracks” the pick).
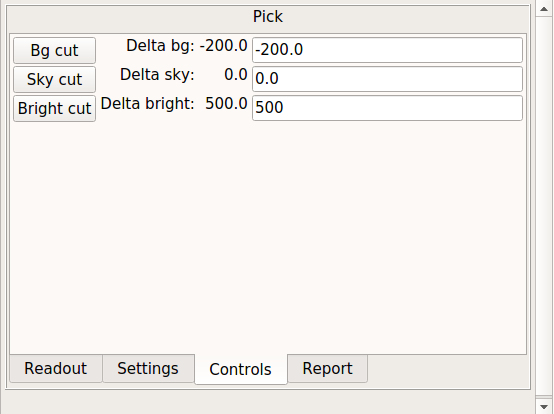
“Controls” tab of Pick area.
The “Controls” tab has a couple of buttons that will work off of the measurements.
The “Bg cut” button will set the low cut level of the channel viewer to the measured background level. A delta to this value can be applied by setting a value in the “Delta bg” box (press “Enter” to change the setting).
The “Sky cut” button will set the low cut level of the channel viewer to the measured sky level. A delta to this value can be applied by setting a value in the “Delta sky” box (press “Enter” to change the setting).
The “Bright cut” button will set the high cut level of the channel viewer to the measured sky+brightness levels. A delta to this value can be applied by setting a value in the “Delta bright” box (press “Enter” to change the setting).
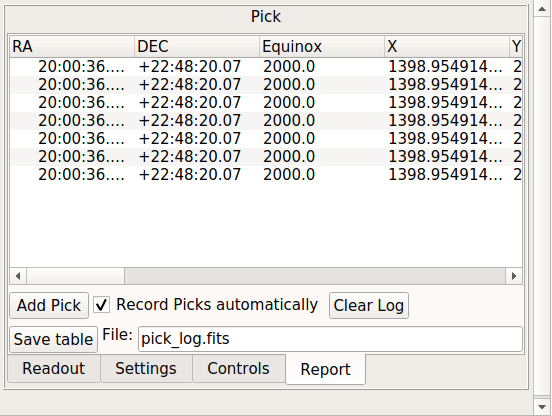
“Report” tab of Pick area.
The “Report” tab is used to record information about the measurements in tabular form.
By pressing the “Add Pick” button, the information about the most recent candidate is added to the table. If the “Record Picks automatically” checkbox is checked, then any candidates are added to the table automatically.
Note
If the “Show Candidates” checkbox in the “Settings” tab is checked, then all objects found in the region (according to the settings) will be added to the table instead of just the selected candidate.
You can clear the table at any time by pressing the “Clear Log” button. The log can be saved to a table by putting a valid path and filename in the “File:” box and pressing “Save table”. File type is automatically determined by the given extension (e.g., “.fits” is FITS and “.txt” is plain text).
If no candidate is found
If no candidate can be found (based on the settings), then the pick area is marked with a red point centered on the pick area.
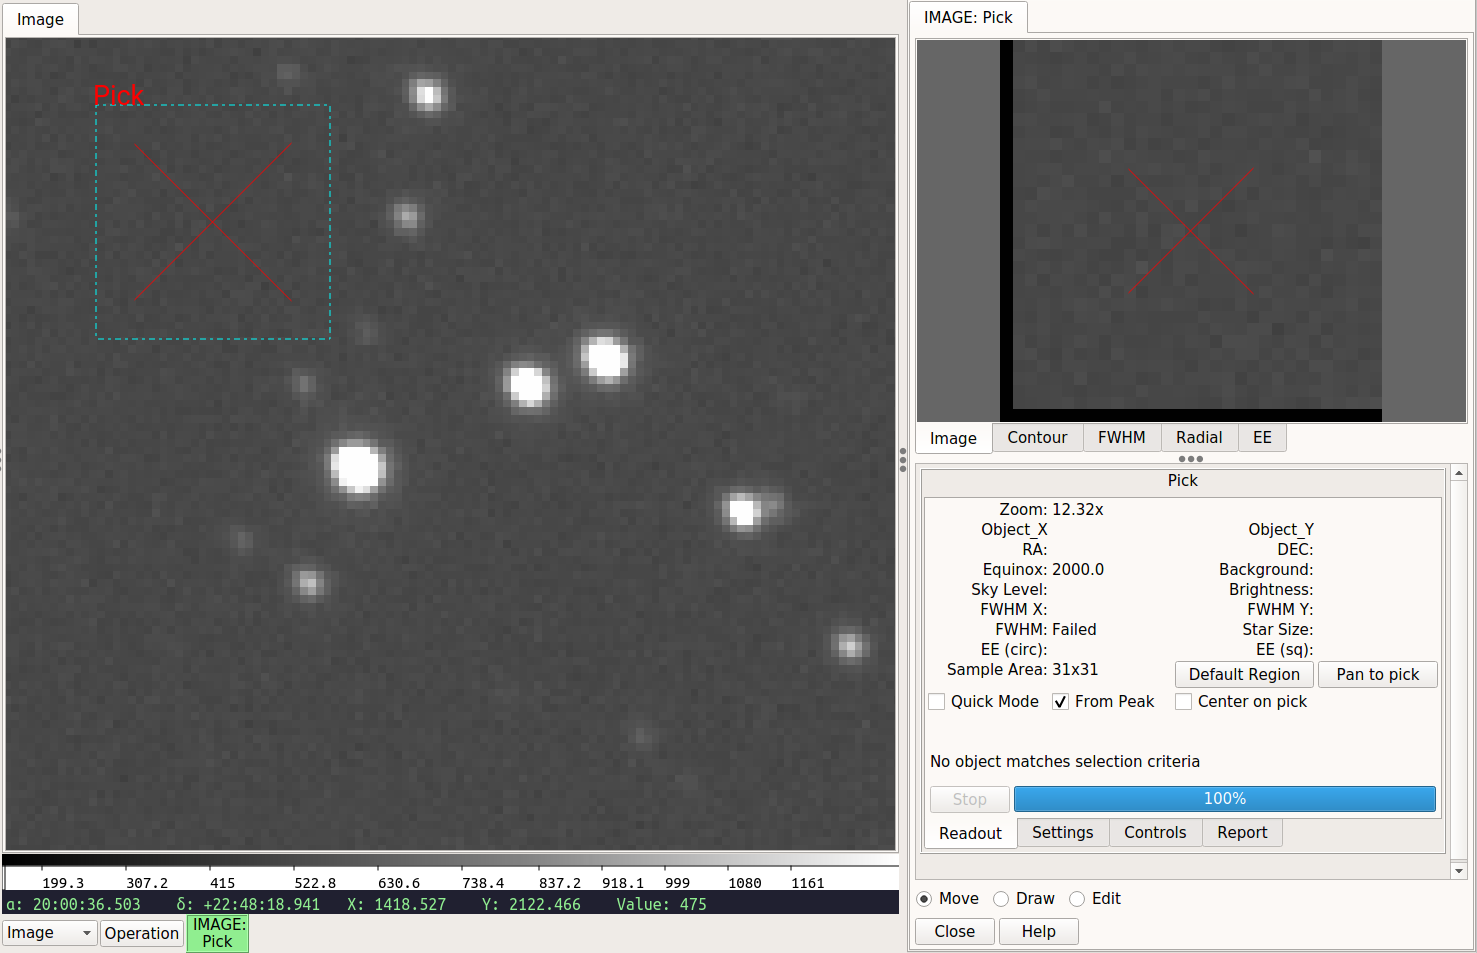
Marker when no candidate found.
The image cutout will be taken from this central area and so the “Image” tab will still have content. It will also be marked with a central red “X”.
The contour plot will still be produced from the cutout.
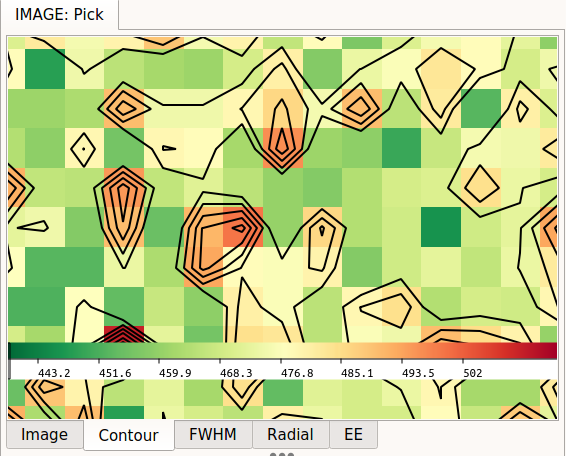
Contour when no candidate found.
All the other plots will be cleared.
The Settings Tab
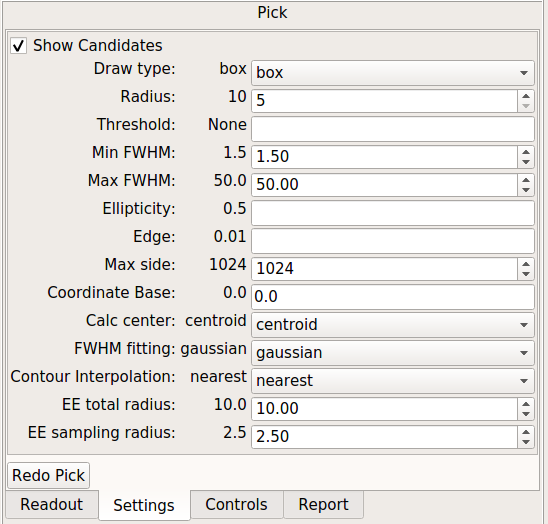
“Settings” tab of Pick plugin.
The “Settings” tab controls aspects of the search within the pick area:
The “Show Candidates” checkbox controls whether all detected sources are marked or not (as shown in the figure below). Additionally, if checked, then all the found objects are added to the pick log table when using the “Report” controls.
The “Draw type” parameter is used to choose the shape of the pick area to be drawn.
The “Radius” parameter sets the radius to be used when finding and evaluating bright peaks in the image.
The “Threshold” parameter is used to set a threshold for peak finding; if set to “None”, then a reasonable default value will be chosen.
The “Min FWHM” and “Max FWHM” parameters can be used to eliminate certain sized objects from being candidates.
The “Ellipticity” parameter is used to eliminate candidates based on their asymmetry in shape.
The “Edge” parameter is used to eliminate candidates based on how close to the edge of the cutout they are. NOTE: currently this works reliably only for non-rotated rectangular shapes.
The “Max side” parameter is used to limit the size of the bounding box that can be used in the pick shape. Larger sizes take longer to evaluate.
The “Coordinate Base” parameter is an offset to apply to located sources. Set to “1” if you want sources pixel locations reported in a FITS-compliant manner and “0” if you prefer 0-based indexing.
The “Calc center” parameter is used to determine whether the center is calculated from FWHM fitting (“fwhm”) or centroiding (“centroid”).
The “FWHM fitting” parameter is used to determine which function is is used for FWHM fitting (“gaussian” or “moffat”). The option to use “lorentz” is also available if “calc_fwhm_lib” is set to “astropy” in
~/.ginga/plugin_Pick.cfg.The “Contour Interpolation” parameter is used to set the interpolation method used in rendering the background image in the “Contour” plot.
The “EE total radius” defines the radius (for encircled energy) and box half-width (for ensquared energy) in pixels where EE fraction is expected to be 1 (i.e., all the flux for a point-spread function is contained within).
The “EE sampling radius” is the radius in pixel used to sample the measured EE curves for reporting.
The “Redo Pick” button will redo the search operation. It is convenient if you have changed some parameters and want to see the effect based on the current pick area without disturbing it.
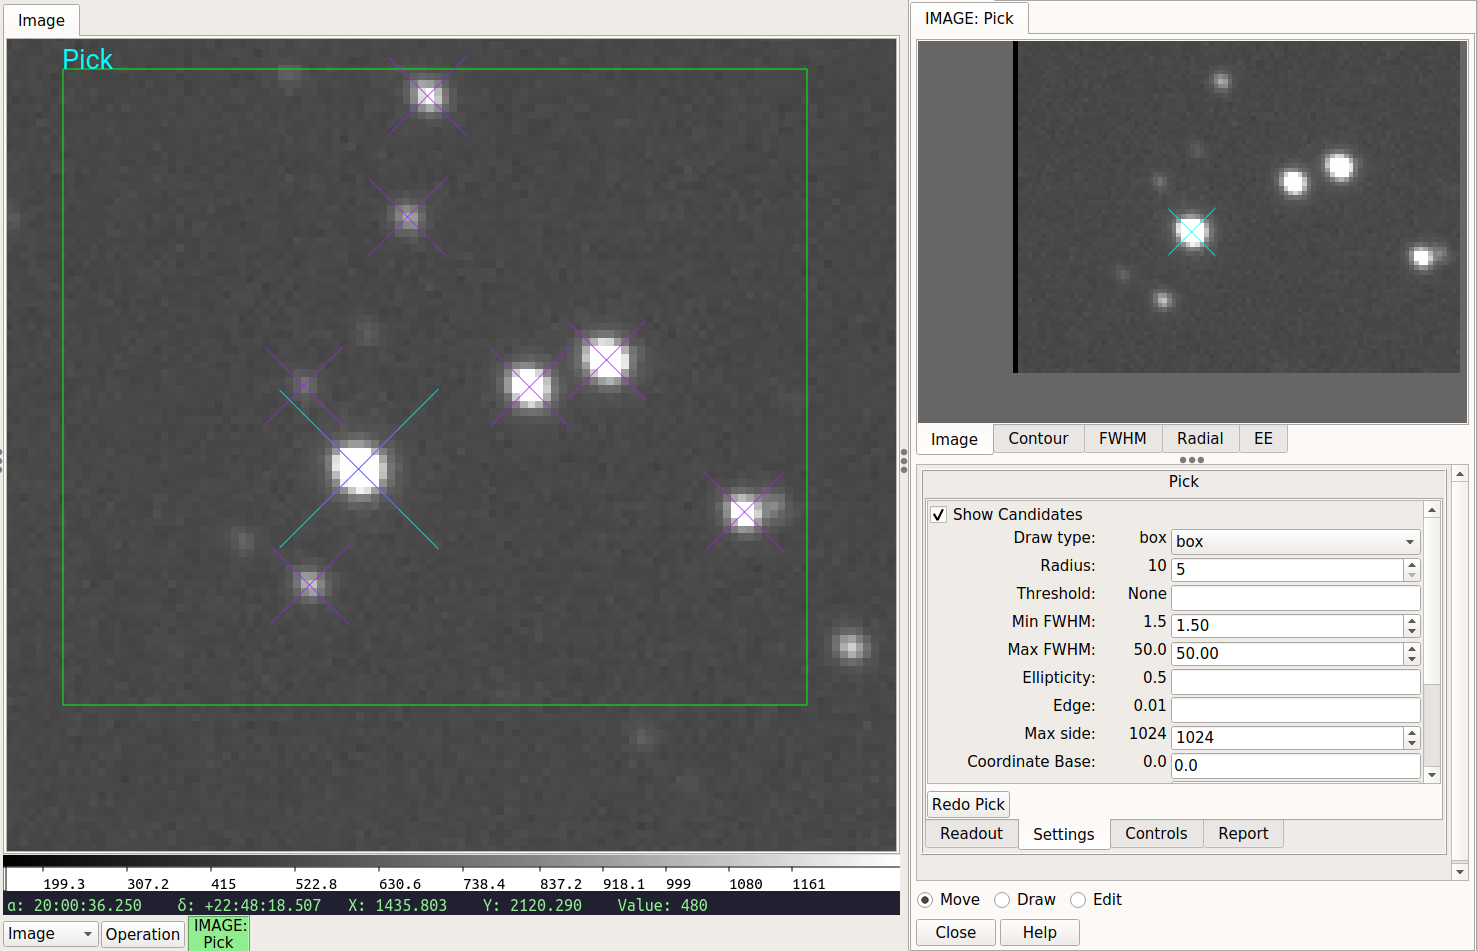
The channel viewer when “Show Candidates” is checked.
User Configuration
It is customizable using ~/.ginga/plugin_Pick.cfg, where ~
is your HOME directory:
#
# Pick plugin preferences file
#
# Place this in file under ~/.ginga with the name "plugin_Pick.cfg"

color_pick = 'green'
shape_pick = 'box'
color_candidate = 'purple'

# Offset to add to Pick results. Default is 1.0 for FITS like indexing,
# set to 0.0 here if you prefer numpy-like 0-based indexing
pixel_coords_offset = 0.0

# Maximum side for a pick region
max_side = 1024

# For image cutout viewer ("Image" tab)
# you can set autozoom and autocuts preferences
cutout_autozoom = 'override'
cutout_autocuts = 'off'

# For contour plot ("Contour" tab)
# widget type: let choose automatically or force 'ginga' or 'matplotlib'
# (choice of 'ginga' requires scikit-image to be installed)
contour_widget = 'choose'
# if ginga widget is chosen, you can set autozoom and autocuts preferences
contour_autozoom = 'override'
contour_autocuts = 'override'
num_contours = 8
# How big of a radius are we willing to consider from the center of the
# pick?  bigger numbers == slower
contour_size_min = 10
contour_size_limit = 70

# should the pick shape recenter on the found object center, if any?
# useful for "tracking" an object that is moving from image to image
center_on_pick = False

# Star candidate search parameters
radius = 10
# Set threshold to None to auto calculate it
threshold = None
# Minimum and maximum fwhm to be considered a candidate
min_fwhm = 1.5
max_fwhm = 50.0
# Minimum ellipticity to be considered a candidate
min_ellipse = 0.5
# Percentage from edge to be considered a candidate
edge_width = 0.01
# Graphically indicate all possible considered candidates
show_candidates = False

# Center of object is based on FWHM ("fwhm") or centroid ("centroid")
# calculation:
calc_center_alg = 'centroid'

# Library to use for FWHM fitting ("native" or "astropy")
calc_fwhm_lib = 'native'

# Fitting function to use for FWHM ("gaussian" or "moffat")
calc_fwhm_alg = 'gaussian'

# Defaults for delta cut levels (in Controls tab)
delta_sky = 0.0
delta_bright = 0.0

# Encircled and ensquared energy (EE) calculations:
# a. Radius (pixel) where EE fraction is expected to be 1.
ee_total_radius = 10.0
# b. Radius (pixel) to sample EE for reporting.
ee_sampling_radius = 2.5

# use a different color/intensity map than channel image?
pick_cmap_name = None
pick_imap_name = None

# For Reports tab
record_picks = True

# Set this to a file name, if None a filename will be automatically chosen
report_log_path = None