LineProfile
A plugin to graph the pixel values along a straight line bisecting a cube.
Plugin Type: Local
LineProfile is a local plugin, which means it is associated with a
channel. An instance can be opened for each channel.
Usage
Warning
There are no restrictions to what axes can be chosen. As such, the plot can be meaningless.
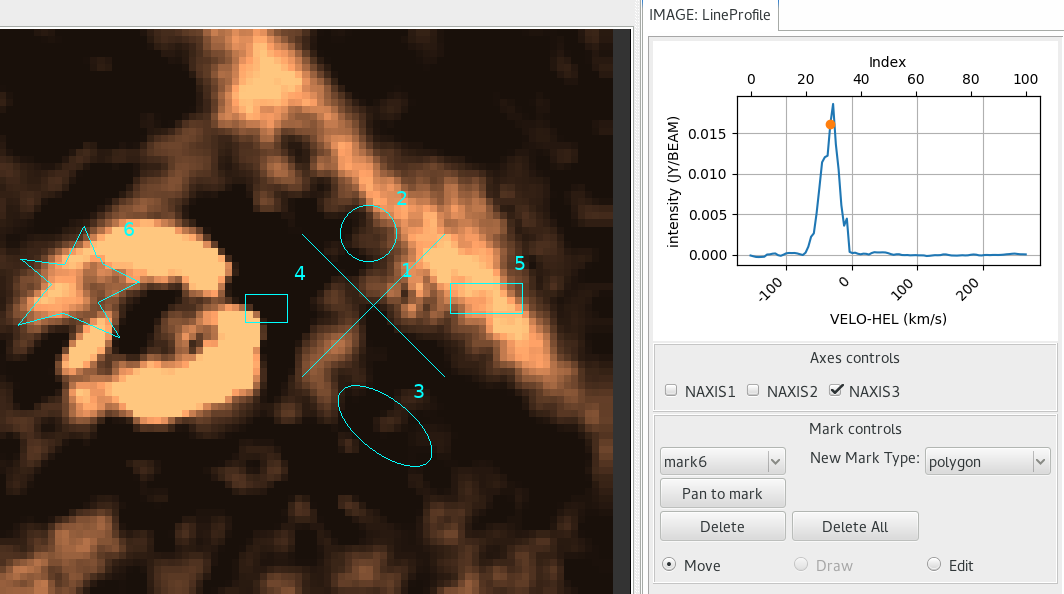
The LineProfile plugin is used for multidimensional (i.e., 3D or higher)
images. It plots the values of the pixels at the current cursor
position through the selected axis; or if a region is selected, it plots the
mean in each frame. This can be used to create normal spectral line profiles.
A marker is placed at the data point of the currently displayed frame.
Displayed X-axis is constructed using CRVAL*, CDELT*, CRPIX*,
CTYPE*, and CUNIT* keywords from FITS header. If any of the keywords
are unavailabled, the axis falls back to NAXIS* values instead.
Displayed Y-axis is constructed using BTYPE and BUNIT. If they are not
available, it simply labels pixel values as “Signal”.
To use this plugin:
Select an axis.
Pick a point or draw a region using the cursor.
Use
MultiDimto change step values of axes, if applicable.