Histogram
Histogram plots a histogram for a region drawn in the image, or for the
entire image.
Plugin Type: Local
Histogram is a local plugin, which means it is associated with a channel.
An instance can be opened for each channel.
Usage
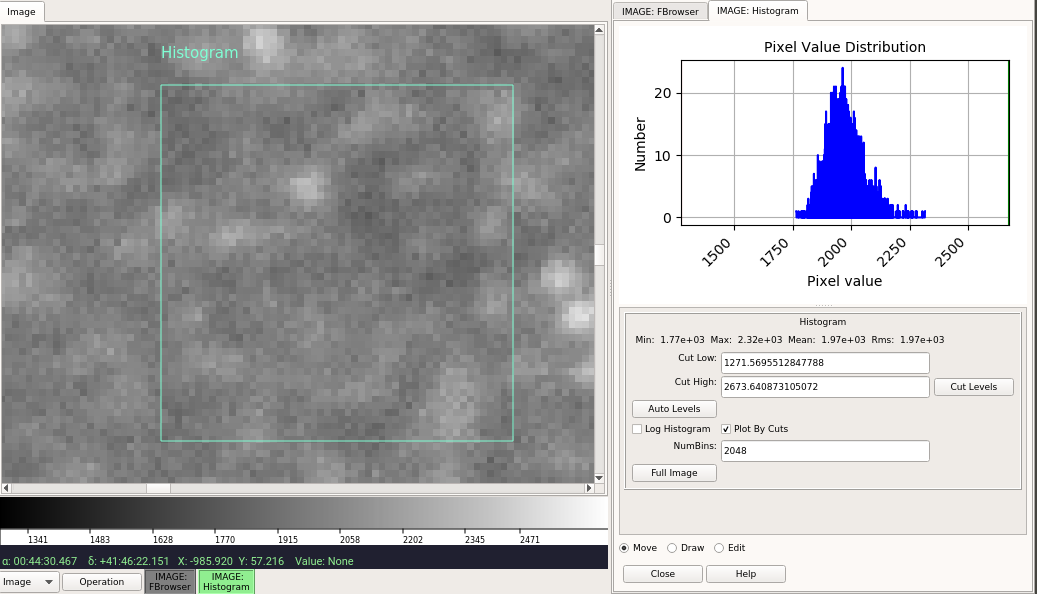
Click and drag to define a region within the image that will be used to calculate the histogram. To take the histogram of the full image, click the button in the UI labeled “Full Image”.
Note
Depending on the size of the image, calculating the full histogram may take time.
If a new image is selected for the channel, the histogram plot will be recalculated based on the current parameters with the new data.
Unless disabled in the settings file for the histogram plugin, a line of simple statistics for the box is calculated and shown in a line below the plot.
UI Controls
Three radio buttons at the bottom of the UI are used to control the effects of the click/drag action:
select “Move” to drag the region to a different location
select “Draw” to draw a new region
select “Edit” to edit the region
To make a log plot of the histogram, check the “Log Histogram” checkbox. To plot by the full range of values in the image instead of by the range within the cut values, uncheck the “Plot By Cuts” checkbox.
The “NumBins” parameter determines how many bins are used in calculating the histogram. Type a number in the box and press “Enter” to change the default value.
Cut Levels Convenience Controls
Because a histogram is useful feedback for setting the cut levels, controls are provided in the UI for setting the low and high cut levels in the image, as well as for performing an auto cut levels, according to the auto cut levels settings in the channel preferences.
User Configuration